Excel Project # 1
To start this project, first watch the video below for context. Then, read the instructions below for more details.
Note that this is a realistic project that you could be given in an actuarial position. It’s similar to a project that I worked on in an actuarial internship position. (Brea)
Instructions
An insurance company sells annuities to individuals age 40+.
The maximum age that the insurance company offers payments to is age 110. Annuitants receive payments once per year.
There are 5 possible annuities that the annuitant could purchase:
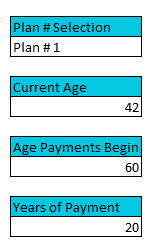
Plan # 1: $15,000 per year; annuitant decides what age payments will start at and how long they’ll go for.
Plan # 2: Payments start at age 65 and go to age 94; initial payment is $25,000 and payments increase by $1000 per year.
Plan # 3: Annuitant decides when payments start, and they go to age 110; $7,200 per year.
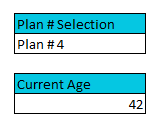
Plan # 4: Payments start at age 60 and go to age 100. Each year, the annuitant gets 1000 per year they’ve been alive. For example, at age 64 the annuitant would get $64,000; the following year when they’re 65, they’d get $65,000.
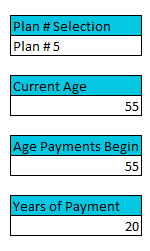
Plan # 5: Annuitant decides what age payments start and end at. The first half of the payments is $19,000. The second half of the payments is $25,000. For example, if the annuitant got 4 years of payments, the first two would be for $19,000 and the second two would be for $25,000.
Part # 1
Your job is to create an annuity illustration tool that will allow insurance agents to quickly and easily illustrate the annuity payments that an annuitant can expect each year from now until the last annuity payment.
Remember, this illustration tool needs to be intuitive for the insurance agents and easy to use. It should look professional.
The insurance agent should be able to input a specific plan number (specified above), as well as any other necessary information and then have an easily understood illustration of what annuity payments the annuitant should expect each year in the future.
Your illustration tool should also provide the following pieces of information: Total Payments (a total of all payments made), Total Years of Payments, and the Age of the Last Payment.
Make sure you complete part # 1 before you move forward.
Hint For Part # 1
You may need to use two particular functions Excel has that weren’t shown during the Excel lessons.
These functions are:
1. The AND function. This function may come in useful if you need two or more specific conditions to be met. For example, if you want to know if cell B12 equals 5 and B13 equals 6, then you might use the function AND(B12=5, B13=6). The result of this function will be TRUE if B12=5 and B13=6. The result will be FALSE if both of those conditions aren’t met.
2. The OR function. This function is similar to the above, but it is TRUE if AT LEAST ONE of the conditions is true. So, for example, OR(B12=5, B13=6) would result in TRUE if B12 equals 5. It would result in TRUE if B13 equals 6. It would be TRUE if B12=5 and B13=6. It would only ever result in FALSE if B12 isn’t 5, and B13 isn’t 6.
These functions may come in handy!
Part # 2
(Complete this after you have already completed part 1)
The insurance company has decided to introduce 2 new annuity plans. Your task is to add these new plans to the illustration tool that you’ve created.
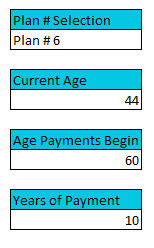
Plan # 6: Annuitant decides which age the payments start and end at. The annuitant receives a total of $100,000 in payments and equal payments are made each year.
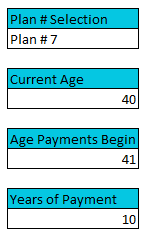
Plan # 7: Annuitant decides which age the payments start and end at. Instead of payments being made each year, they’re made every second year. Each payment is $30,000. The initial payment of $30,000 occurs at the age the annuitant selects as the “start” age. The following year’s payment will be $0. Then the next year’s payment will be $30,000, etc.
Hint for Part # 2
You may need to use two particular functions Excel has that weren’t shown during the Excel lessons.
These functions are:
1. The ISODD function. This function will let you know if the value in a particular cell is an odd number. For example, if B12 has the value 6 in it, then ISODD(B12) would result in FALSE. But, if B12 had the value 7 in it, then ISODD(B12) would result in TRUE.
2. The ISEVEN function. This one works exactly the same as the one above, but only results in TRUE if the value in the cell is even!
Professional Tip: When completing projects like these, it’s extremely important that you always check your work before handing it to your manager. This will help your manager learn to trust you and rely on you. ALWAYS check your work. Quality beats quantity.
Reasonability checks can be done to make sure that nothing looks odd. Think of areas in your work where you could set up a true/false verification. For example, in Plan # 6, payments should always total 100,000. Could you add a check into your work to verify that this is always true? Are there other places you could add true/false verifications?
Actuaries also often do spot checks. This means that you create a list of 10-20 (sometimes more) specific scenarios and the expected result for those scenarios. Then, input each scenario into your illustrator tool and ensure that you get the expected results. Remember to include some “unexpected” scenarios in your list too. (ie. How will your tool react if the current age is 45 but payments are set to start at age 40? How will your tool react if the agent accidentally inputs “Plan # 11”?)
So, after you complete your illustration tool, take 30-60 minutes to check your tool’s accuracy.
Part # 3
To get further context, watch the video below and then read the instructions below the video to get the details you need to complete part # 3.
Uh oh! Jarred (the new insurance agent) accidentally messed up my illustration tool which you can download here. You’ve been assigned the task to debug and fix it.
Below is a list of 5 problems I’m experiencing (explained further in the video above). Once you’ve figured out the cause of the problems in my illustration tool, make the appropriate changes and clearly document the changes you make in a Word doc.
Problem # 1: When I input this scenario below, I get a message on the Illustration Calculator tab that “something is wrong”.
Problem # 2: When I input the scenario below, the payment amount at age 95 and 96 are the same amount.
Problem # 3: When I input the scenario below, the payments start at age 61 instead of age 55.
Problem # 4: When I input the scenario below, the payments start at age 66 and they total more than $100,000.
Problem # 5: When I input the scenario below, the payments start at age 47 and one of the payments is 60,000 instead of 30,000.
Solutions
Before you look at the solutions, it’s extremely important that you try to do the project yourself. Otherwise, you’ll only be learning a small portion of what you could learn.
If you’re stuck, ask in the WhatsApp group! Members there will be more than happy to help you get through the project. Many of them have already done it and love helping others.
Solutions to Part 1 and 2: Click here to download.
Solutions to Part 3: Click here to download (spots that need to be fixed are highlighted in red)